About Charts - Data Visualization and Business Analytics
Experience true multi-gesture interactivity with Charts. Pivot dimensions, turn pages, hide series elements, sort data, change orientation, explode pie or donut slices, rotate pie and donut, change donut width with simple...
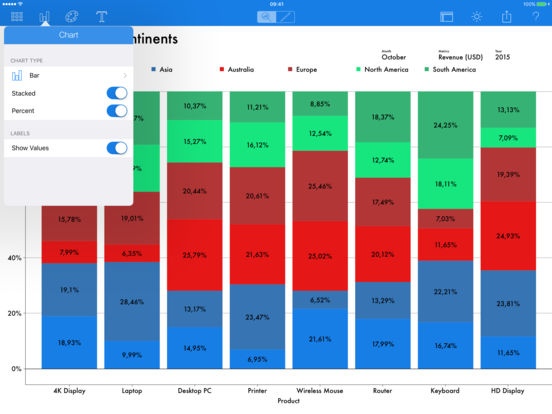
Experience true multi-gesture interactivity with Charts. Pivot dimensions, turn pages, hide series elements, sort data, change orientation, explode pie or donut slices, rotate pie and donut, change donut width with simple gestures. Create professional looking charts quickly, using a wide range of visualization and formatting options. Define your datasets only once and reuse them later with different chart types. If you like Charts please take the time to rate the app or write a nice review! We would really appreciate it! If you have some suggestions or find some bugs please contact us at
[email protected]. * * * What you get: VISUALIZATION - single bar/column chart - grouped, clustered bar/column chart - vertical and horizontal orientation DATA - manual data entry - unlimited datasets - up to 12 metrics per dataset - up to 6 dimensions per dataset - unlimited dimension elements - automatic aggregation ANALYTICS - pivot metrics and dimensions - turn pages to select data slices or simply filter data - hide serie elements - sort data alphabetically or by value FORMATTING - Day view mode - 12 fonts - 3 color themes - standard data markers - align title and subtitle - automatic legend sizing and alignment - automatic label sizing and alignment - automatic data range calculation SHARING - save charts locally in Photos - email charts as pictures - print charts * * * What you can ADD: CHARTS PACK - Chart types - Line - Area - Pie - Donut - Chart subtypes (for bar, line, area) - Stacked - Percent FORMATTING PACK - additional View Modes - additional Color Themes - Axis formatting - Gridline styles and spacing - Tick Mark positions - element layout - value formats - Series formatting - additional Data Marker shapes, fills and outline - series label alignment - Explode any pie or donut slices - Change Donut width
Requires iOS 8.0 or later. Compatible with iPad.
Previous Versions
Here you can find the changelog of Charts - Data Visualization and Business Analytics since it was posted on our website on 2016-10-13 13:34:13.
The latest version is 1.1.1 and it was updated on 2024-04-22 21:44:36. See below the changes in each version.
Charts - Data Visualization and Business Analytics version 1.1.1
Updated At: 2015-04-15
Disclaimer
Official App Store Link
We do not host Charts - Data Visualization and Business Analytics on our servers. We did not scan it for viruses, adware, spyware or other type of malware. This app is hosted by Apple and passed their terms and conditions to be listed there. We recommend caution when installing it.
The App Store link for Charts - Data Visualization and Business Analytics is provided to you by apps112.com without any warranties, representations or guarantees of any kind, so access it at your own risk.
If you have questions regarding this particular app contact the publisher directly. For questions about the functionalities of apps112.com contact us.